
As a business owner, I’m sure that when it comes to marketing you pay close attention to your ROI (Return on Investment). The only way to know if your business’ marketing efforts are successful is to measure them. So, how do you know what impact your website is making? Have you ever heard of the expression ‘Google has all the answers’? Well, once again…they do.
Google provides a free website visitor tracking tool, called Google Analytics. After signing up for a free account, Google gives you a snippet of code that you can embed into each page of your website. Once installed, Google will track all website behaviors and provide detailed reporting in your Google Analytics dashboard. While it can be overwhelming at first glance, I want to share with you the top three metrics in Google Analytics and what they mean.
AUDIENCE
On the left hand side of your Google Analytics admin, you will see a series of tabs. Under the audience tab you will find the following key metrics:
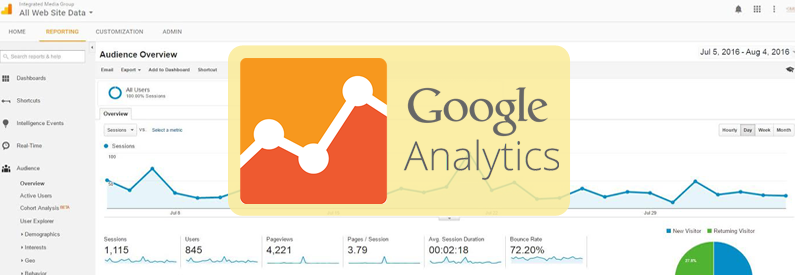
- Session – any visit to your website, including a visitor coming back multiple times
- Users – unique visitors to your website (sessions minus any returning users)
- Page views – the total number of pages from your website that have been viewed
- Page/Session – average number of pages that each user visits on your website
- Bounce rate – the percentage of people that only visit one page on your website and leave without going to any secondary pages
What you need to know about your audience:
You should expect to see your pages per session over 3. This would mean that each website visitor would visit at least 3 pages (on average). If your pages per session is low, that could mean that your content isn’t engaging or that your home page message isn’t connecting with your target audience. A website should have a clear call-to-action (CTA). Some effective calls to action are request a quote, schedule a consultation, contact us today or view our special offers. You should also make sure your bounce rate stays below 40%. If your bounce rate is too high, it means people are not finding what they expected to find on your site. Clear messaging, simple navigation, and a call-to-action will help with that as well.
ACQUISITION
The next key metric in your analytics account is acquisition. This section will explain how you acquired your website views. Did they come from your social media posts, from Google, or did they type in your website address directly? This is the section you can find those answers. Here are the main categories of how your website can acquire visitors:
- Direct – when the user directly types in your website URL into the address bar
- Referral – this is traffic coming from other sites that linking to your site
- Organic Search – a list of which search engines and keywords are driving traffic to your website
- Social – which social networks are driving traffic
- Other – not as common, but other will show alternative sources of web traffic to your site
What you should look out for in your acquisition metrics
Websites have a habit of getting spam traffic from other sites. There are automated “bots” that people create to search the web and report back with various results. This spam traffic often skews your numbers. To find out if your website is getting spammed, take a close look at the referrals option and see if there are sites that you don’t identify.
BEHAVIOR
The last key metric to help give you a general understanding of how your site is performing is behavior. This is where you can see which pages are the most visited, which pages are the least visited, and how long people spend on those pages. This is useful when making digital marketing decisions like where to drive traffic to in social and email campaigns. It also helps us gauge if our most important pages, such as contact us, request a quote or buy now, are being visited.
How can you change a user’s behavior to match your website goals?
If people aren’t visiting the pages you’d like them to, try to focus more on clear calls to action or link directly to those pages from email campaigns and social media posts. By adjusting the order of your links, linking to pages within the body of your website content, and having important buttons in different colors, you can drive people to the pages that matter most.
So how does your website stack up? If you need help driving more web traffic, or converting more traffic to leads, feel free to contact me!
